![]()
Testing > By Type > Tensile Test
Tinius Olsen
Tensile Test

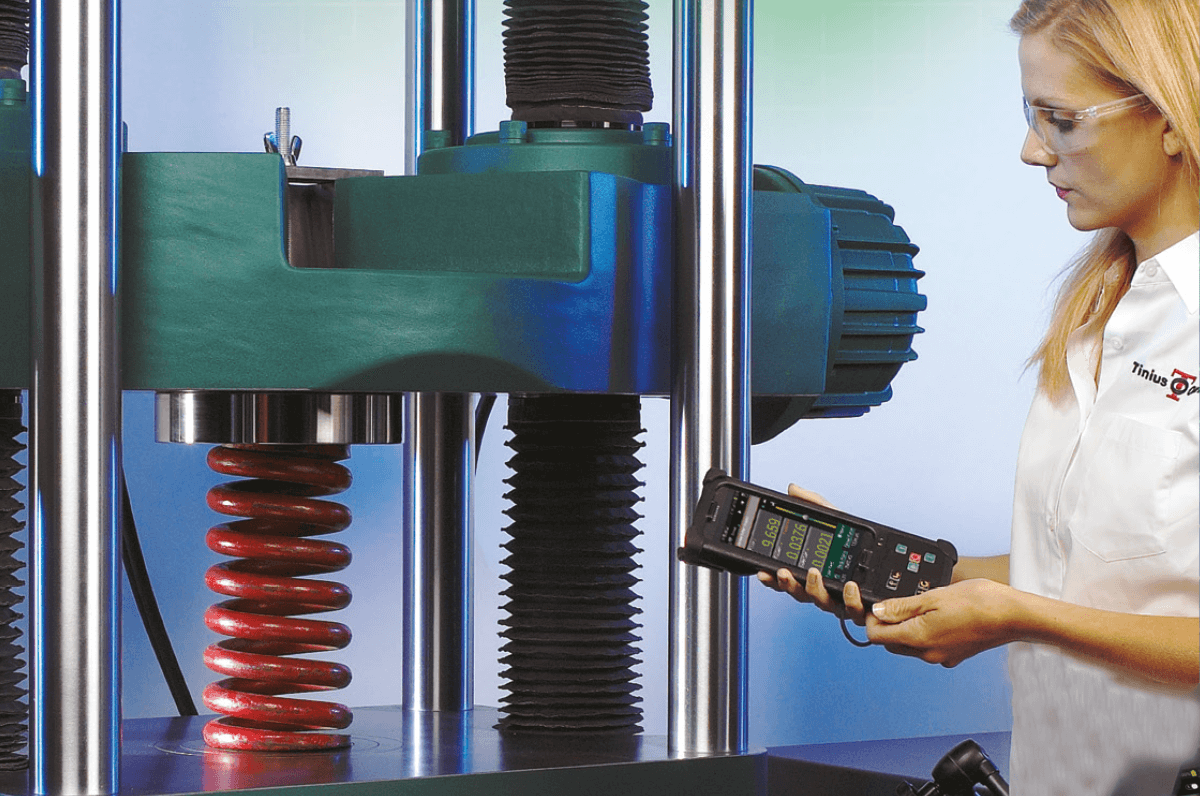


Tinius Olsen is the leading specialist manufacturer and supplier of static tension and/or compression materials testing machines. Our machines are designed for use in Research departments and Quality Control departments to measure material’s strength and product performance. Using Tinius Olsen equipment it is possible to perform such tests on raw materials such as metals, polymers, textiles, rubbers, adhesives, food as well finished components. Our equipment is designed to test a wide spectrum of materials including metals, plastics, rubber, textiles, paper, yarn, wire, adhesives, ceramics, timber, foils, composites and finished components in tension, compression, flexure or shear.
Hundreds of different types of grips are available to hold your specimen during the course of the test, whether that test is tensile, compressive, flexure, shear, peel, tear or frictional in nature. If we don't have a standard grip that successfully holds your unique specimen, we have a full grip design engineering team who can design a specialised grip according to your needs.
What is a tensile test?
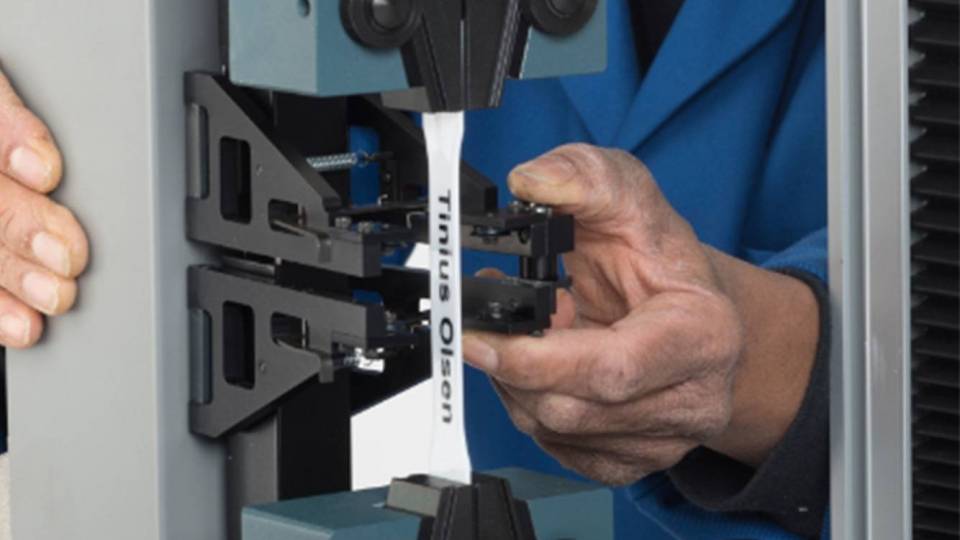
A tensile test is a test where a clamped specimen is subjected to a constant rate of tensile loading such that it stretches and ultimately breaks. Typically these tests are performed in accordance with an internationally recognised standard procedure and calculation of results so that the data is portable between labs. The rate of loading can be applied as either a constant rate of extension, constant rate of strain or constant rate of load, depending on the standard.
Tensile strength σUTS, or SU is the stress at which a material breaks or permanently deforms. Tensile strength is an intensive property and, consequently, does not depend on the size of the test specimen. However, it is dependent on the preparation of the specimen and the temperature of the test environment and material.
Tensile strength, along with elastic modulus and corrosion resistance, is an important parameter of engineering materials that are used in structures and mechanical devices. It is specified for materials such as alloys, composite materials, ceramics, plastics and wood.
The various definitions of tensile strength are shown in the following stress-strain graph. For our purposes here, the graph used is representative of the properties for low-carbon steel:
Stress vs. Strain curve typical of structural steel
1. Ultimate Strength
2. Yield Strength
3. Rupture
4. Strain hardening region
5. Necking region.
Metals, including steel, have a linear stress-strain relationship up to the limit of proportionality, which is most often close to the yield point, as seen in the above graph. In some steels the stress falls after the yield point; this is due to the interaction of carbon atoms and dislocations in the stressed steel. Work hardened and alloy steels do not show this effect and for most metals, yield point is not sharply defined. If loading is removed prior to reaching the limit of proportionality, or yield point, the material will return to its initial shape, however once the yield point is exceeded, the deformation is permanent and the material will not return to its initial shape. This permanent deformation is known as plastic deformation and for many applications plastic deformation is unacceptable, so the material’s properties at its yield point are used as the design limitation.
In a normal tensile loading test, steel and many other ductile metals will undergo a period of strain hardening, once the yield point has been passed, in which the stress increases again with increasing strain up to the ultimate strength. If the material is unloaded at this point, the stress-strain curve will be parallel to that portion of the curve between the origin and the yield point. If it is re-loaded it will follow the unloading curve up again to the ultimate strength, which has become the new yield strength.
After a metal has been loaded to its yield strength it begins to “neck” as the cross-sectional area of the specimen decreases due to plastic flow. When necking becomes substantial, it may cause a reversal of the engineering stress-strain curve, where decreasing stress correlates to increasing strain because of geometric effects. This is because the engineering stress and engineering strain are calculated assuming the original cross-sectional area before necking. If the graph is plotted in terms of true stress and true strain the curve will always slope upwards and never reverse, as true stress is corrected for the decrease in cross-sectional area. Necking is not observed for materials loaded in compression. The peak stress on the engineering stress-strain curve is known as the ultimate strength. After a period of necking, the material will rupture and the stored elastic energy is released as noise and heat. The stress on the material at the time of rupture is known as the tensile strength.
Ductile metals do not have a well defined yield point, so in these cases we have to “invent” one. The yield strength is typically defined by the “0.2% offset strain”. The yield strength at 0.2% offset is determined by finding the intersection of the stress-strain curve with a line parallel to the initial slope of the curve and which intercepts the abscissa at 0.2%. A stress-strain curve typical of aluminum along with the 0.2% offset line is shown in the figure below.
Stress vs. Strain curve typical of aluminum
1. Ultimate Strength
2. Yield strength
3. Proportional Limit Stress
4. Tensile strength
5. Offset Strain (typically 0.2%).
Brittle materials such as concrete and carbon fiber do not have a yield point, and do not strain-harden which means that the ultimate strength and breaking strength are the same. A most unusual stress-strain curve is shown in the figure below. Typical brittle materials do not show any plastic deformation but fail while the deformation is elastic. One of the characteristics of a brittle failure is that the two broken parts can be reassembled to produce the same shape as the original component. A typical stress strain curve for a brittle material will be linear. Testing of several identical specimens will result in different failure stresses. The curve shown below would be typical of a brittle polymer tested at very slow strain rates at a temperature above its glass transition temperature. Some engineering ceramics show a small amount of ductile behaviour at stresses just below that causing failure but the initial part of the curve is a linear.
Stress vs. Strain curve of a very untypical brittle material
1. Ultimate Strength
2. Tensile strength.
Tensile strength is measured in units of force per unit area. In the SI system, the units are Newtons per square meter (N/m²) (or pascals (Pa)). The Imperial, or English, units are pounds-force per square inch (lbf/in² or PSI), however engineers in the USA usually use units of ksi which is a thousand psi.
If you have questions about a specific test type or application not found please email or call for more information.
